 50.002 CS
- Debug Project
- Select Signals
- Build Project
- Load Project
- Wait
- Open Wave Capture
- Connect and Capture
- View Signals
- Capture At Will
50.002 Computation Structures
Information Systems Technology and Design
Singapore University of Technology and Design
Ian Goh (Spring 2022)
Debugging the FPGA
This document is written to guide you with debugging the FPGA using Alchitry Lab’s builtin debug feature. That being said, there’s nothing wrong using outputs such as the LEDS or 7-segment display to debug. Use whichever method you prefer.
Debug Project
Start by selecting the Debug Project (bug looking icon) in the toolbar.
![]()
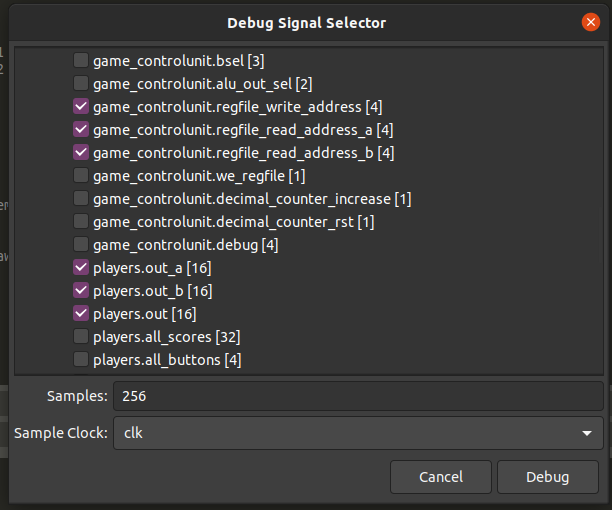
Select Signals
Select the signals you would like to capture during debugging by ticking the respective checkboxes. Here are two sample scenarios:
Example to debug FSM current state (0-indexed in output):

Example to debug REGFILE read addresses and output:
Build Project
Build the project by clicking on Debug.
Wait patiently… very patiently…
Load Project
Once the build has completed, load the project onto the FPGA by clicking the Program (Flash) button.
![]()
Wait
Wait for the FPGA to start up.
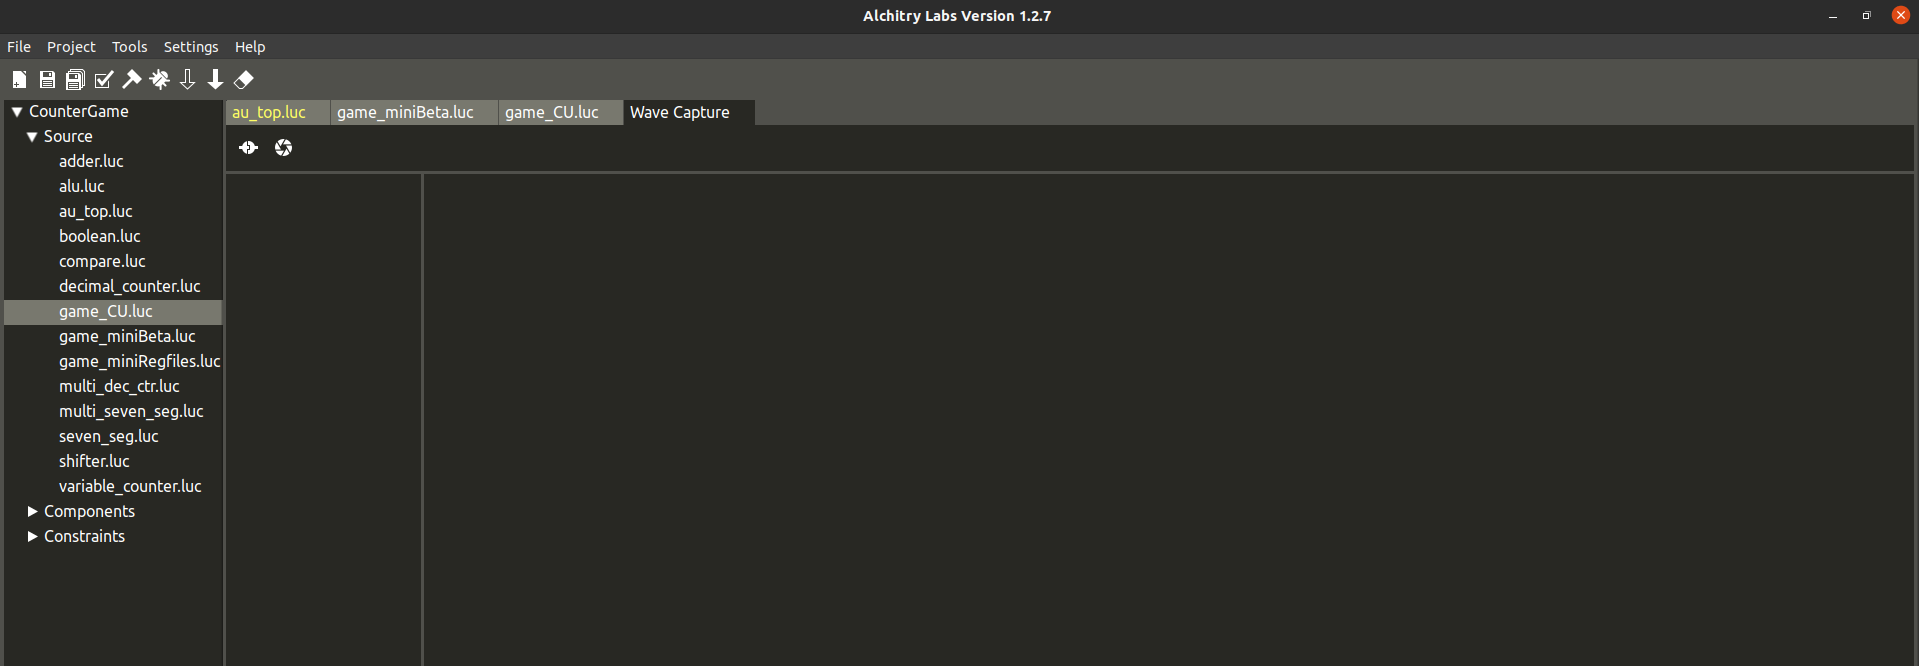
Open Wave Capture
Open the Wave Capture tab by going to Tools > Wave Capture.
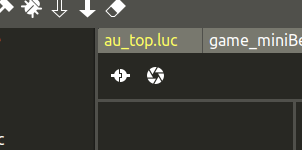
Connect and Capture
Click on Connect (left button) followed by Capture (right button).
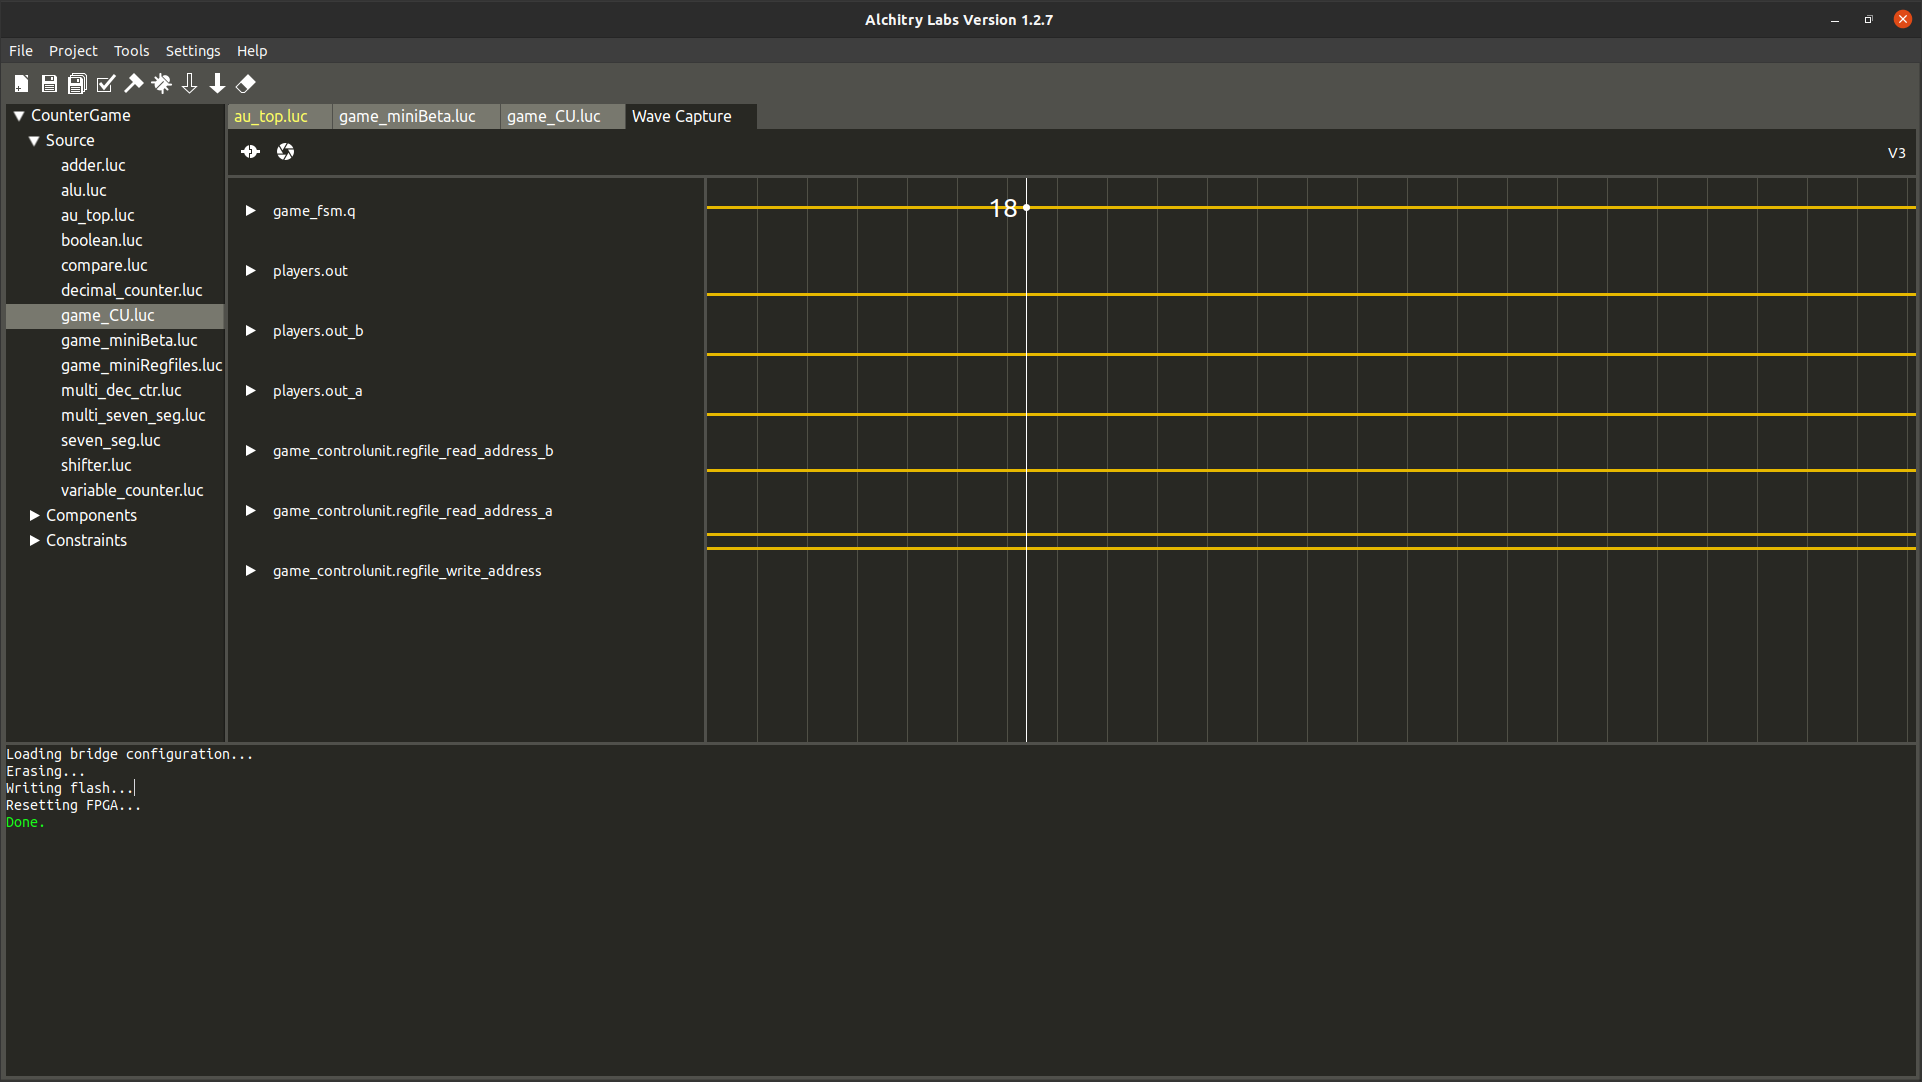
View Signals
You should now be able to view the signals you selected earlier. Hover over the signal lines to view the values in decimal or expand the view to see each individual bit.
Capture At Will
You are now able to capture the signals at any point in time during execution by clicking on the Capture button in the Wave Capture tab.
Good luck debugging!