- Processing Delay
- Queueing Delay
- Transmission Delay
- Propagation Delay
- Total Nodal Delay
- Average Link Utilisation
- Real Internet Delays and Routes
- Packet Loss
- Throughput and Bandwidth
- Network Performance Visualisation
- Summary
- Appendix
50.005 Computer System Engineering
Information Systems Technology and Design
Singapore University of Technology and Design
Natalie Agus (Summer 2025)
Network Performance
Detailed Learning Objectives
- Identify Network Performance Metrics
- Explain the concept of network performance including efficiency and reliability in data transmission.
- Identify the factors that impact network performance such as latency and throughput.
- Breakdown Sources of Packet Delay
- Describe the four main sources of packet delays: processing, queueing, transmission, and propagation.
- Identify how each type of delay affects the overall network performance.
- Experiment with Tools for Measuring Network Delays
- Experiment with network diagnostic tools like
traceroute,pingand their functionalities.- Learn how traceroute uses ICMP to map the route data packets take across the network.
- Comprehend how ICMP works and its significance in error messaging and network diagnostics.
- Analyze the practical application of ICMP in tools like
tracerouteandping.- Analyze Packet Loss and Its Implications
- Identify the causes and consequences of packet loss within a network.
- Practice how to compute end-to-end loss rate probability based on per-link loss rates.
- Distinguish Between Throughput and Bandwidth
- Define and differentiate between throughput and bandwidth in network contexts.
- Discover the calculations and factors affecting throughput, including network topology and link technologies.
- Visualize Network Performance
- Demonstrate the use of space-time diagrams in visualizing network data flow and performance.
- Analyze how changes in network parameters like bandwidth and packet size affect the data transmission represented in time-space diagrams.
These learning objectives are designed to provide a comprehensive understanding of network performance, including how to measure, analyze, and optimize the efficiency and reliability of data transmission across networks.
Network performance refers to the efficiency and reliability of data transmission across a network. Packet delays, which can stem from factors such as network congestion, routing inefficiencies, and packet processing delays, directly impact the overall performance of a network by influencing latency and throughput.
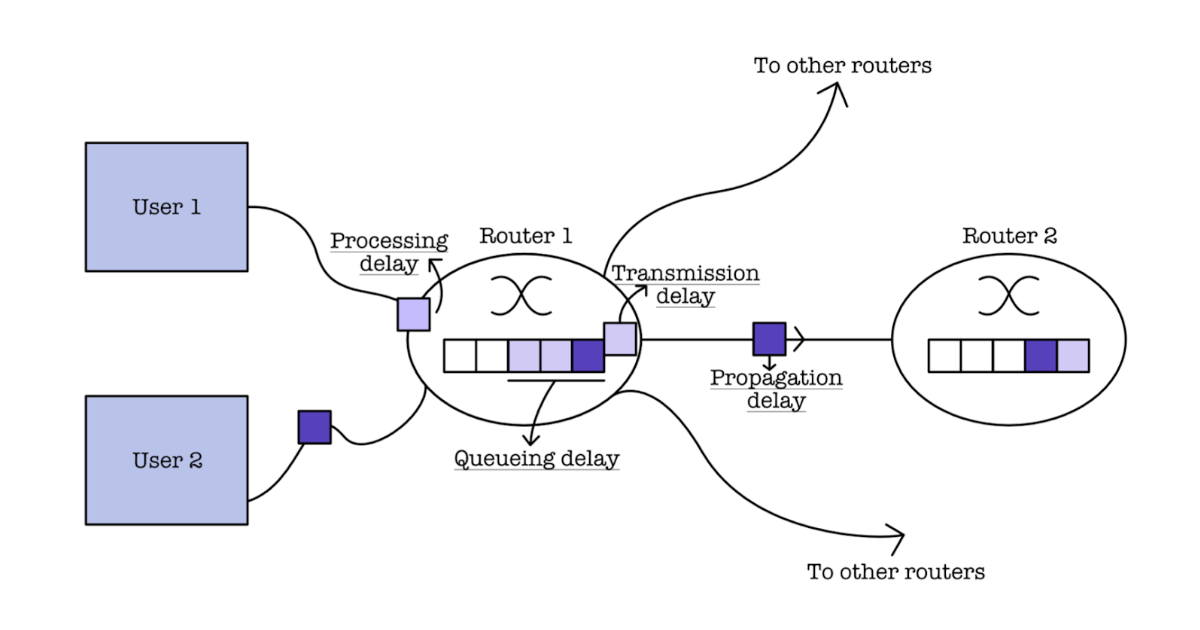
When packets arrive at network nodes (i.e. router) they queue in the router’s local buffers, waiting for their turn to be dispatched towards the destination host.
An end host has a complete network stack, whereas a node can have partial network stack.
There are four sources of packet delay that affects network performance:
Processing Delay
Processing delay is the time it takes for a network device, such as a router or switch, to examine a packet’s header and determine where to forward the packet.
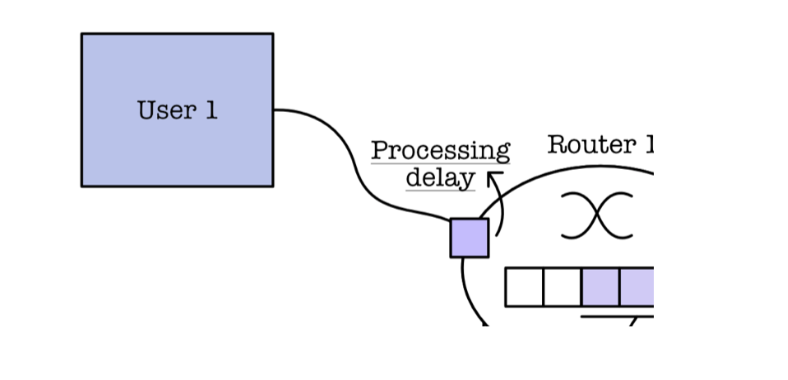
Duration: < milliseconds, usually is bounded or fixed. It is affected by the device’s performance (e.g: router’s CPU speed, memory speed, and its software efficiency).
Cause: Needs time to examine packet header.
- Check for bit errors (checksum),
- Compute output link as denoted by destination IP address.
Routers typically have multiple output ports, each leading to a different network or device. These output ports allow routers to forward data packets to the appropriate destination based on their routing tables and the destination IP addresses of the packets
Queueing Delay
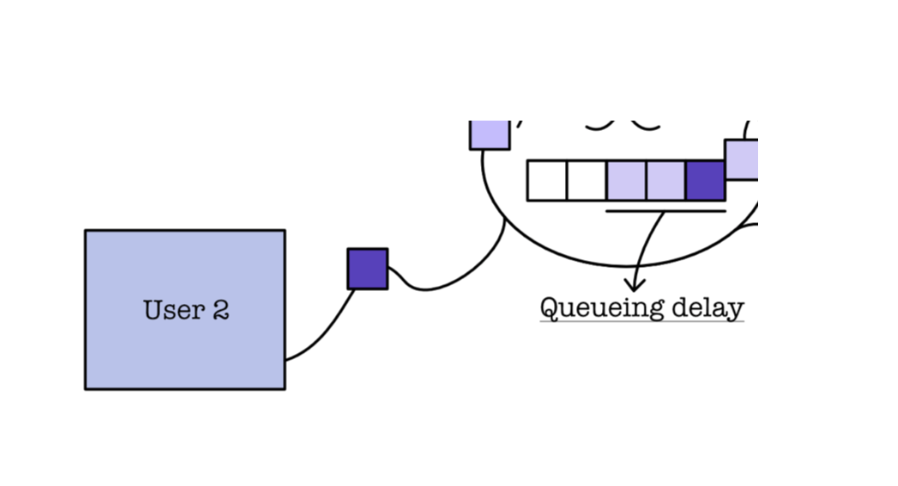
Queueing delay is the time a packet spends waiting in a queue before it can be transmitted onto the network link
Duration: varies, depending on traffic (congestion level). It is non trivial to compute.
Cause: packet input rate > link output rate, therefore packet needs to wait in the node buffer to get to the front of the queue to reach the output link.
Transmission Delay
Transmission delay (also known as transmission time) is primarily determined by how fast the bits are pushed into the link
Duration: varies, depends on bandwidth (link technology). The amount of transmission delay is computed as: \(d_{trans} = \frac{L}{R}\), where \(L\) is packet length in bits and \(R\) is link bandwith in bits/s.
Cause: Need time to push the whole packet bits, e.g: 512 Bytes from the router to the link itself.
Propagation Delay
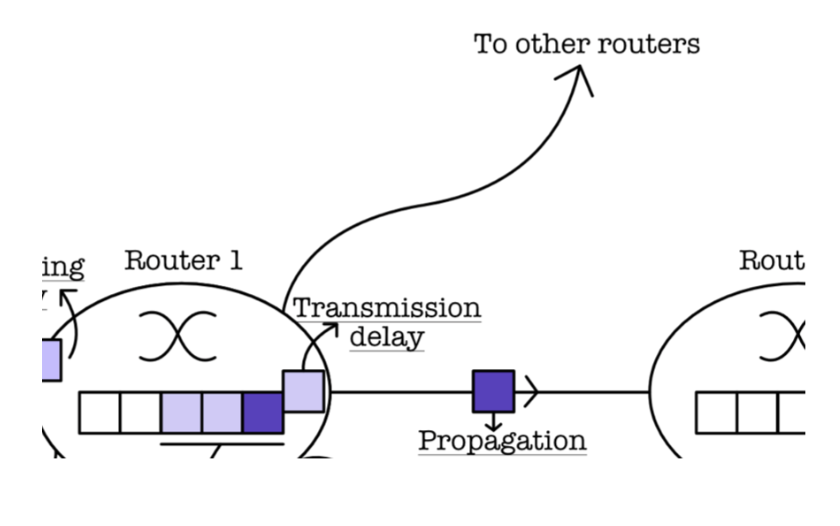
Propagation delay is the time it takes for a signal to travel from the sender to the receiver over a given medium
Duration: depends on the physical length of the link. The amount of propagation delay is computed as: \(d_{prop} = \frac{d}{S}\), where \(d\) is the link length in metres, and \(S\) is the propagation speed of bits on medium, it can be approximated to \(2\times10^8\) m/s.
Total Nodal Delay
The total nodal delay (from one node/router) to another node/router is the sum of all types of delays: \(d_{nodal} = d_{proc} + d_{queue} + d_{trans} + d_{prop}\).
Average Link Utilisation
The average link utilisation model is obtained from observation. The model below is assumed based on random and bursty packet arrivals:
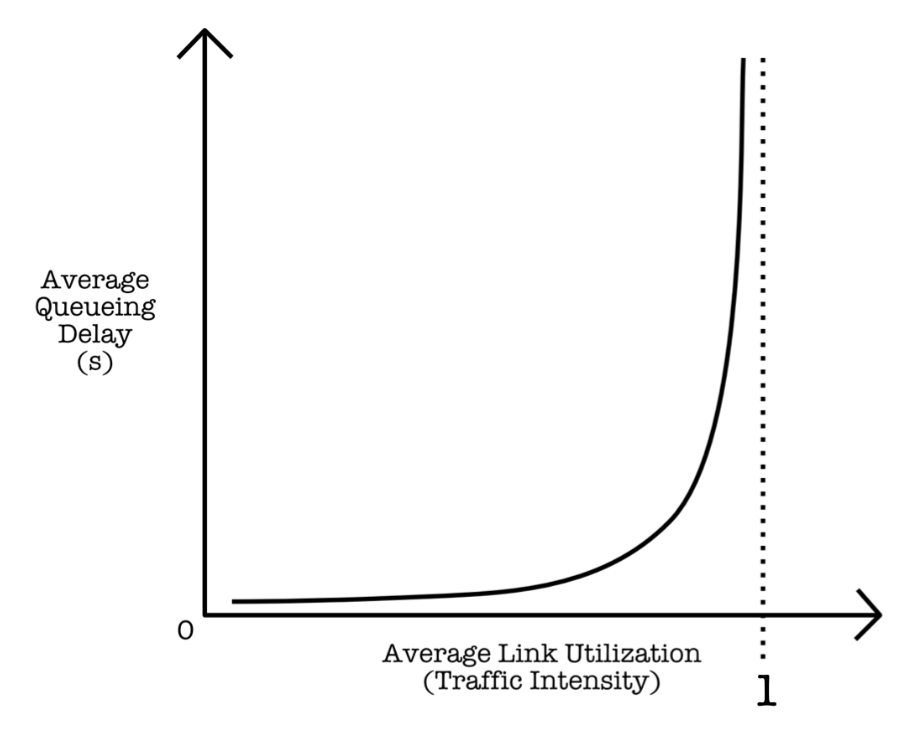
The average queueing delay is related to the average link utilization (traffic intensity). It approaches infinity as the average link utilization approaches 1.
The formula for average link utilization is \(\frac{La}{R}\) where \(L\) is packet length in bits, \(a\) is average packet arrival rate (packets/second), and \(R\) is the link’s bandwith in bits/s.
Analysis
Queueing delay is a convex increasing function of utilization:
- If average link utilization 0, average queueing delay is small
- If average link utilization is near 1, average queueing delay is large
- If average link utilization > 1, average queueing delay is infinite (there’s more work arriving that can be serviced)
Key takeaway: should not try to use every bit of the link capacity.
Real Internet Delays and Routes
Traceroute
There exists multiple hops (on routers) before data from a source host arrives at the destination host. You can measure delay from source to each router along the Internet path towards destination using traceroute utility.

A sample output of traceroute to google.com is as follows:
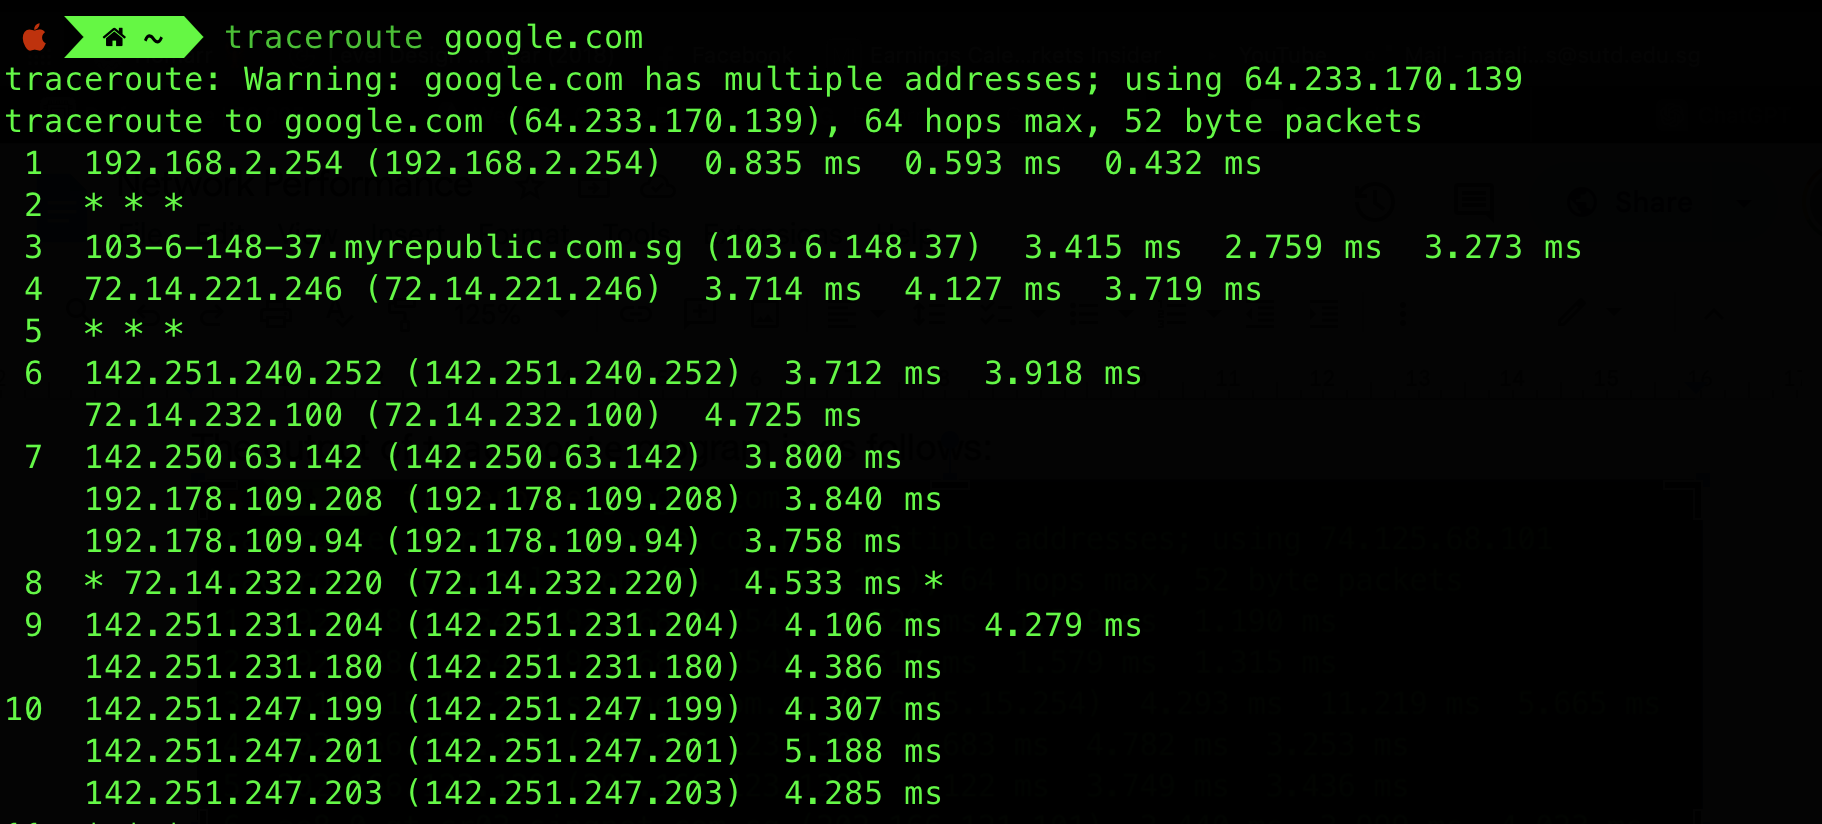
Here we see that there are at least 10 probes in total (result truncated).
How traceroute works
Traceroute is a network diagnostic tool used to trace the path that data packets take from one point to another on a network. Traceroute relies on ICMP (Network Layer protocol) to work.
It works by sending a series of packets, each forming a probe with an incrementally increasing time-to-live (TTL) value, towards the destination. The TTL value determines how many network hops (routers) the packet can pass through before being discarded. Each router decrements the TTL value by one. When the TTL reaches zero, the router discards the packet and sends an ICMP “Time Exceeded” message back to the sender.
ICMP
ICMP stands for Internet Control Message Protocol, a supporting protocol in the Internet Protocol Suite.
It is a protocol for error messages and operational information (standard messages), mainly not used by the application itself but used by the network operators to identify errors, perform diagnostics, and generally are used for control purposes.
It is not typically critical for normal operation, hence it is not usual for it to be disabled, misconfigured, or buggy. This is why you see some * * * (no response, timeout) in the traceroute output.
ICMP is actually implemented at the “top” of layer 3 (network layer). It relies on IP protocol to deliver data to a remote host. In other words, ICMP messages must be encapsulated in IP packets.
Probe
At each probe i, traceroute sends 3 packets that will reach router i (means the router reached after i hops) on path towards destination. These packets are ICMP Echo packets with TTL (time to live) value of i. Each router in the path will decrease the TTL by 1.
The final value of i is unknown in the beginning. It starts from 1 and it will be increased by 1 at each iteration. It’s maximum is set to be certain number, e.g: 64 in example above.
Router at hop i will be the last router in the path that decreases the TTL (TTL will reach 0 at this point), and will respond to the sender, the traceroute process, by sending ICMP TTL Exceeded packet because it is not the destination router. Remember tin the example above: the destination is google.com.
The other routers at hop <i will simply decrement the TTL as explained above.
RTT
The traceroute process measures the time from packet sent until packet is received back from router i for each probe: RTT (round trip time). RTT depends on various factors: network infrastructure, distance between nodes, network conditions, and packet size.
Traceroute listens for these ICMP messages, recording the IP addresses of the routers along the path. By repeatedly sending packets with increasing TTL values and recording the responding routers, traceroute builds a map of the network path to the destination.
Termination
The traceroute program (in UNIX-like OS) sends packets to a likely unusable port in the destination, e.g: 50000. When the packet reaches the destination, the destination host finds out that the packet is destined for a port that is unusable.
The destination host will send back an ICMP Port Unreachable message, where upon receiving this the traceroute program stops sending more packets.
Port
A port is a 16 bits logical representation of a service or application in the host system. Upon receiving the incoming packet, the network management subsystem of your OS will try to forward the packet to the application that’s bound to the particular port.
Ping
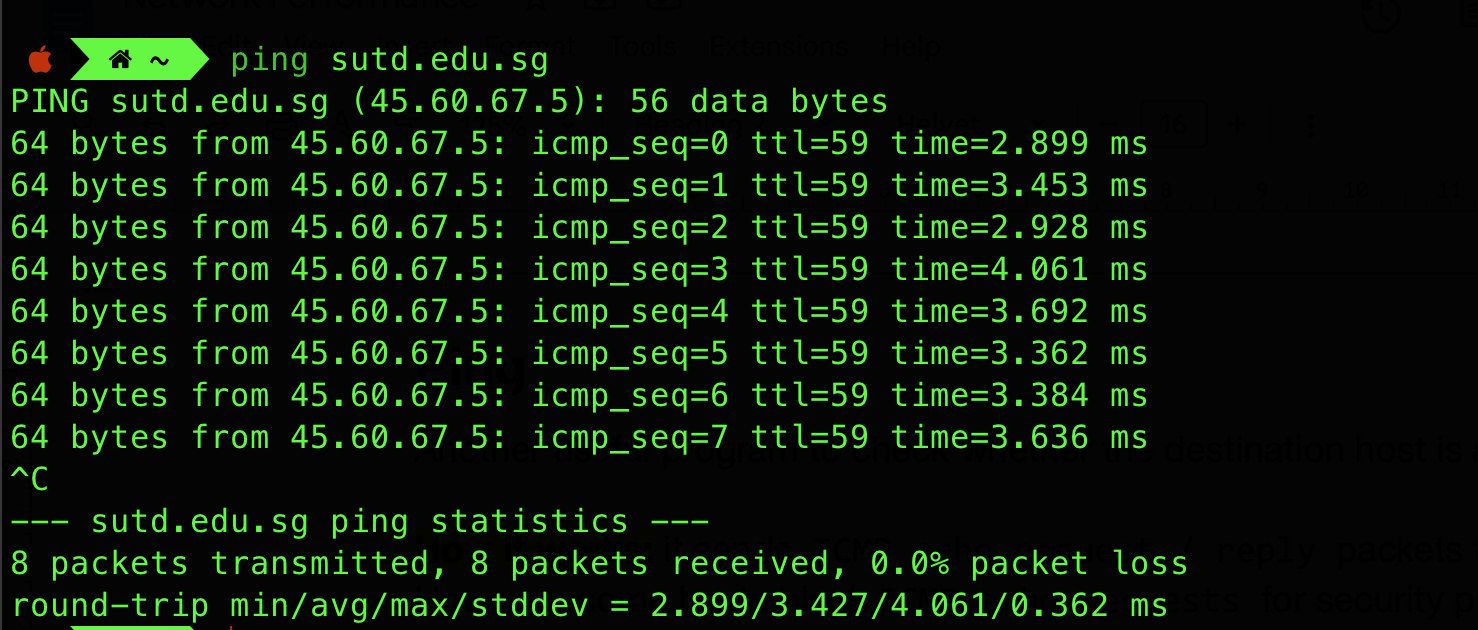
Ping is a another network utility used to test the reachability of a host on an Internet Protocol (IP) network and measure the round-trip time for messages sent from the originating host to a destination computer and back. It also relies on ICMP to work.
How it works: it sends ICMP echo request / reply packets to the destination host. However, some hosts block ICMP echo requests for security purposes.
 no-invert
Here’s a sample output of the ping utility:
Packet Loss
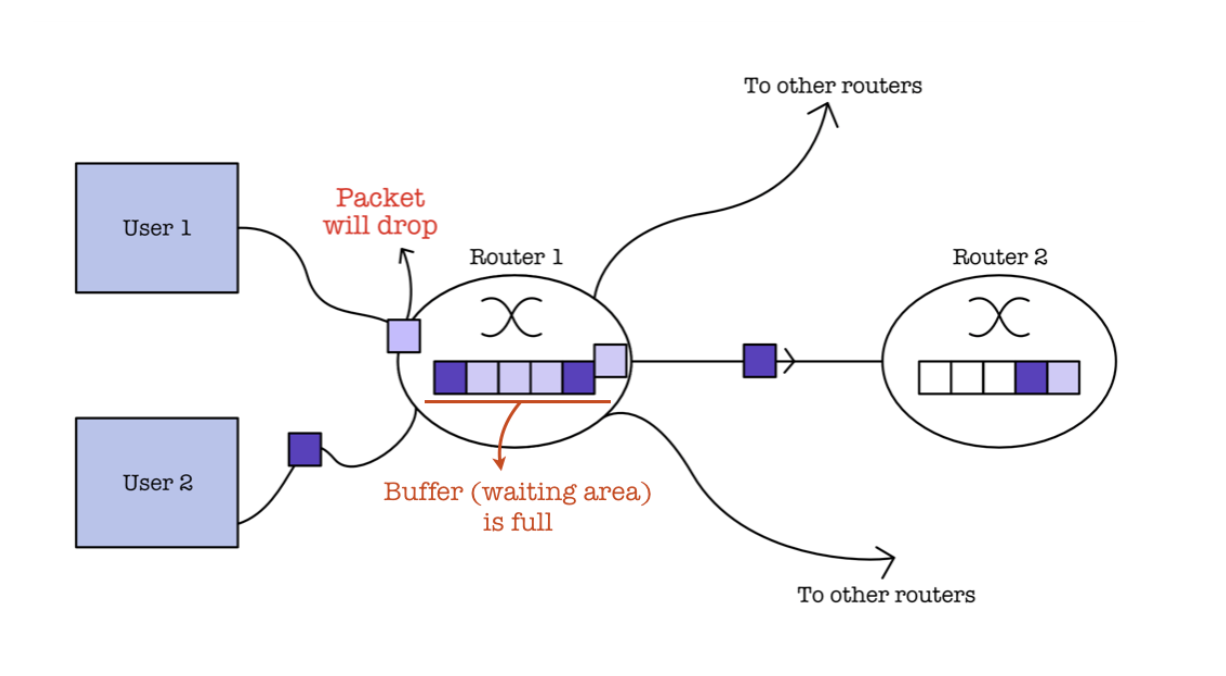
Earlier we learned that packets will queue in the local buffer of a network node if packet arrival in the input link exceeds the output link capacity.
Packets that arrive at a full queue (full buffer) will be dropped (lost). They may be retransmitted by the previous node, source system, or not at all. Loss is random, where each link has an average loss rate or probability.
You can compute end-to-end loss rate probability given per-link loss rate probability. For example, given the following network topology and per-link loss rate:

We can compute the end-to-end loss rate between A to C as: \((1 - (0.8 * 0.9)) * 100\% = 28\%\)
Throughput and Bandwidth
Throughput is defined as the rate (bits/time unit) at which bits are actually transferred between sender/receiver. Bandwidth is defined as the maximum amount of data that can travel through a link.
Throughput computation is application specific, depending on factors such as latency, SNR (hardware limitations), etc. For example, at TCP level, the throughput depends on RTT (round trip time) and window size.
Throughput is different from bandwidth. Bandwidth is the theoretical maximum capacity of a network link, while throughput is the actual observed data transfer rate under real-world conditions.
There are two ways to calculate throughput: instantaneous and averaged. The number seconds used for the measurement of throughput separates between the two computation:
- Instantaneous throughput: if the measurement is taken over a very short time interval
- Average throughput: if the measurement is taken over a long time interval, for example, the transfer a bunch of large files.
Average throughput is usually more consistent than instantaneous throughput. Average throughput represents the data transfer rate over a longer period, smoothing out fluctuations and providing a more stable indication of network performance compared to instantaneous throughput, which may vary significantly due to factors like congestion, bursty traffic, or network conditions.
Link bandwidth varies depending on its material/technology:
- T1 Line (1.5 Mbps)
- Fast Ethernet (100 Mb/s)
- T3 Line (43 Mbps)
- Gigabit Ethernet (1Gb/s)
- OC192 (9.95 Gb/s)
This capacity of a link (bandwidth) is a combination of the physical characteristics of the transmission medium, the technology and standards applied, the quality and configuration of the network equipment, and the environmental conditions in which the network operates. You will learn more about it if you take a full Networks class, but you can read this appendix section if you’re curious about what factors affect bandwidth.
We can compute end-to-end throughput based on the bottleneck link. For instance, given the following network topology and bandwidth:

If Host A wish to send packets to host C, where the throughput of each link is as shown in the diagram above, Host A can only do so with throughput of 3 MBps.
Note that b stands for bit, while B stands for Byte.
Bandwidth or throughput in calculations?
It’s common to use the term “bandwidth” when discussing network topology and link capacities in throughput computation questions. This is because in theoretical or simplified network scenarios, the bandwidth of a link represents its maximum capacity, which is a key factor in determining the potential throughput of data transmission across that link.
Therefore, while “throughput” refers to the actual observed data transfer rate, in theoretical scenarios or when designing networks, it’s often assumed that the link operates at its maximum capacity (bandwidth) under ideal conditions. Therefore, using “bandwidth” in such contexts is appropriate for simplicity and clarity in calculations and network design discussions.
Now consider another network topology:
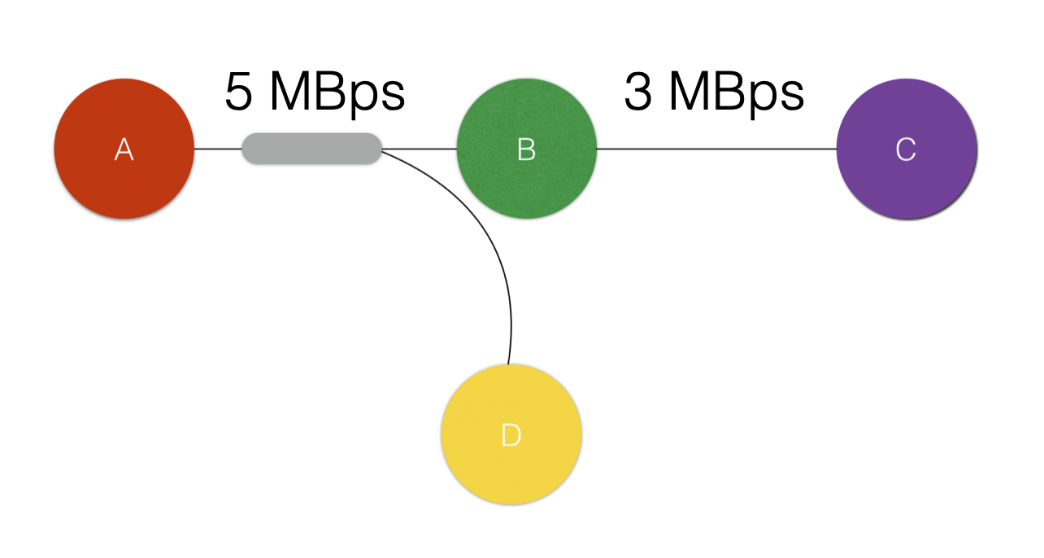
When a link is shared among N connections, each connection may (unless otherwise stated) get an equal share of the transmission rate, i.e: the transmission rate is divided equally and each connected host (A, B, and D) gets 2.5 MBps each. Therefore the throughput from A to C becomes 2.5 MBps instead.
Network Performance Visualisation
The Space-time Diagram
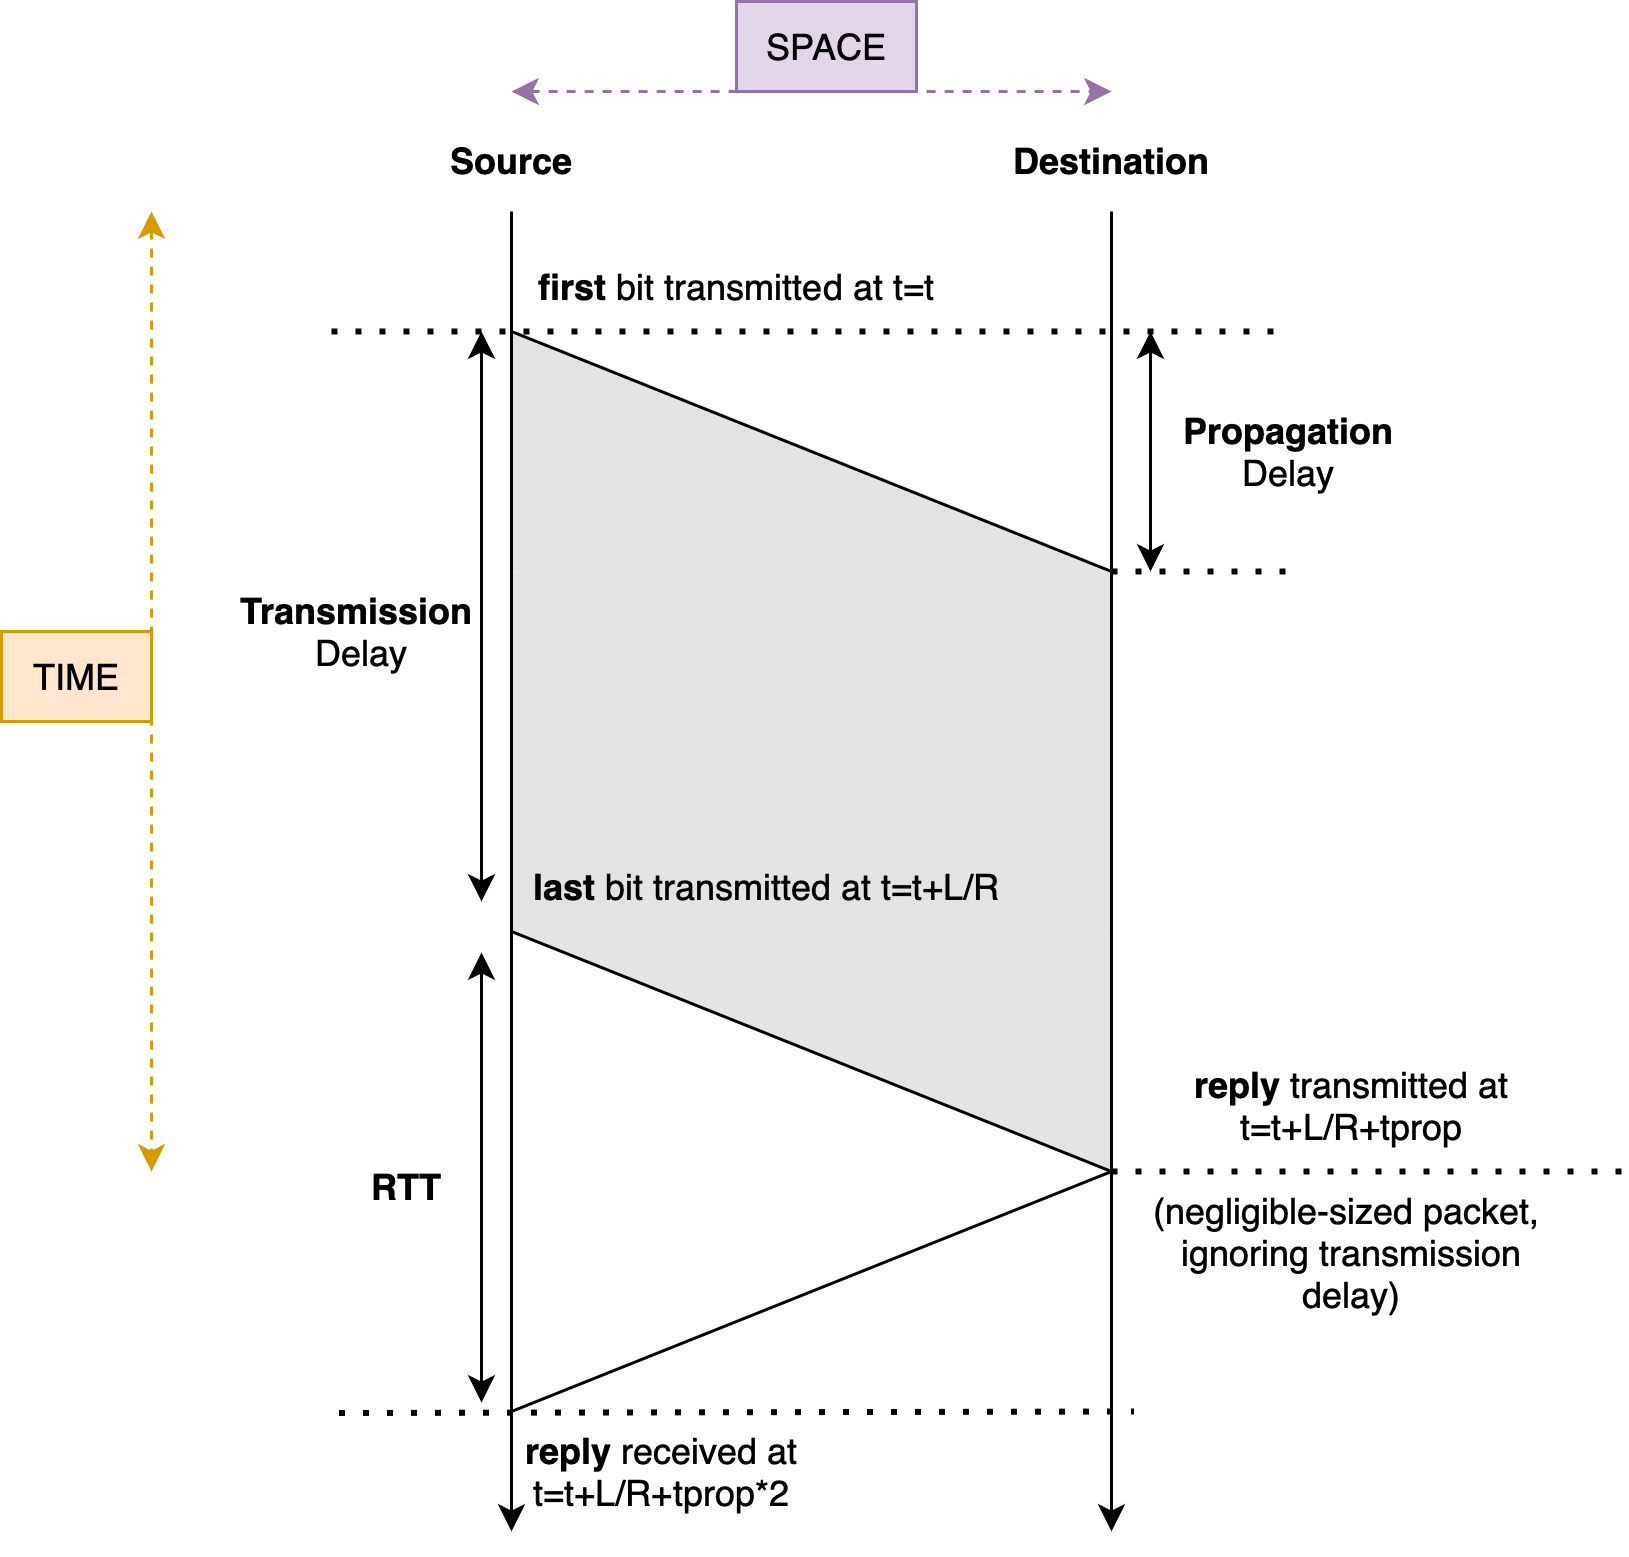
The space-time diagram as shown below can be used to visualise network performance.
- Vertical direction represents time, while horizontal direction represents space between source and destination points (distance). You can compute the last bit transmitted given \(L\) (packet length) and \(R\) (bandwidth).
- Here we often omit the illustration of queueing delay
- We also omit the illustration of transmission delay for negligible-sized packets (e.g: packets so small that transmission delay won’t matter)
- We also severly simplify the diagram and assume that there are no other nodes between the source and destination (this is not true in practice, as the packets between source and destination would need to go through several routers)
Network performance is throughput and delay limited, and the only way to improve it is by using faster links with bigger bandwidth.
Ask yourself: will the slope of the transmission line in the space-time diagram ever change between the same source and destination? Why or why not? What does it represent?
Please head to Class Activities for more practice.
Illustrating Processing and Queueing Delay
We will not ask you to illustrate processing and queueing delay in this course. This section is just for exercise purposes.
A packet experiences different delays on its path through the network. We have learned in class that there are 4 major sources of packet delays: processing, queueing, transmission, and propagation delay. If we would like to illustrate processing and queueing delay between source and destination host using the space-time diagram, we would need to illustrate each node (e.g: each router and/or switch) passed between the source and destination host.
The following diagram shows how we can do that:
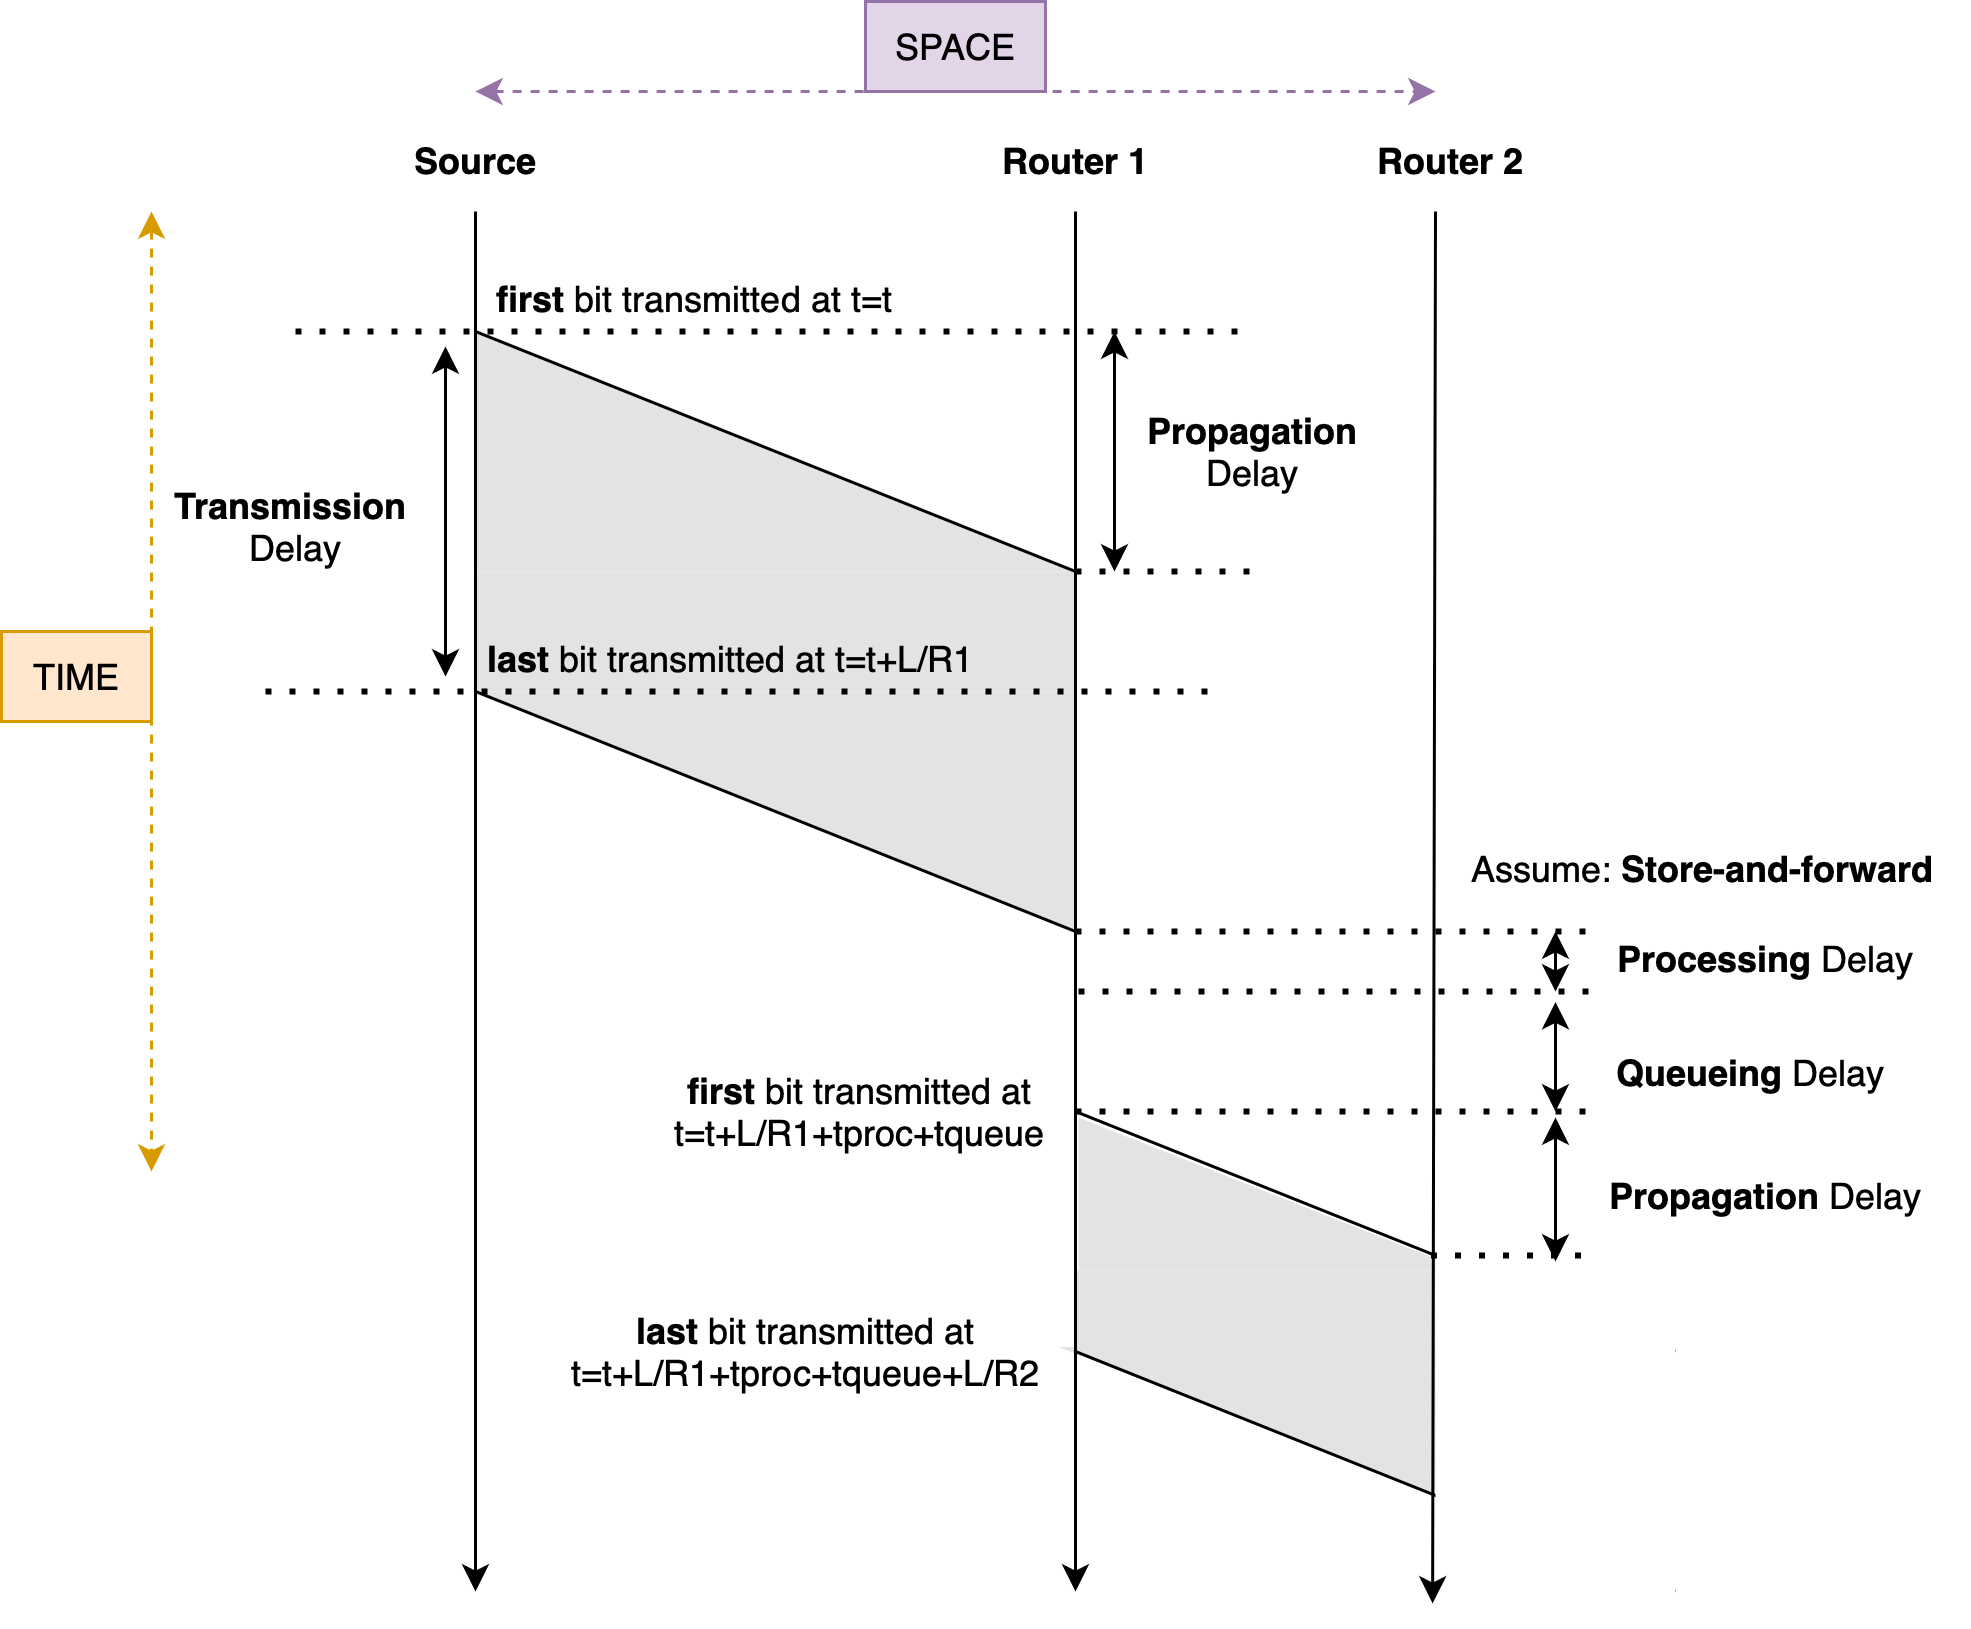
There are a few things that you can observe from this diagram:
- The bandwidth between source and router 1 is less than between router 1 and router 2
- Router 1 performs store-and-forward packet switching technique
- The physical distance between source and router 1 is more than between router 1 and router 2
- The “slope” remains the same because it is affected only by propagation speed
- Therefore, if two signals have the same slope in a space-time diagram, it implies that they are traveling through media with similar propagation speeds
- The link between the source host and router 1, and between router 1 and router 2 must have similar propagation speed
Store and forward
Store-and-Forward is a packet-switching technique in which the router receives an entire data packet, temporarily stores it, and then forwards it to the next node in the network. This process involves checking the packet for errors and ensuring it is complete before sending it on its way.
This is different from another packet-switching technique called Cut-Through-Switching. Unlike store-and-forward, cut-through switching starts forwarding the packet as soon as the destination address is read, without waiting for the entire packet to arrive. This reduces latency but may forward corrupted packets.
Summary
In this chapter on network performance, we explore the critical aspects that influence the efficiency and reliability of data transmission across networks. We present you with different types of packet delays: processing, queueing, transmission, and propagation; and their impact on overall network performance. The chapter also covers essential diagnostic tools like traceroute and ping, which help map network paths and measure connectivity and speed. Furthermore, we explain concepts like throughput versus bandwidth and the implications of packet loss, providing a thorough understanding of how to analyze and optimize network performance.
Key learning points include:
- Types of Network Delays: Breaks down the key contributors to network latency: processing, queueing, transmission, and propagation delays.
- Diagnostic Tools: Highlights the use of tools like traceroute and ping to measure these delays and diagnose network performance issues.
- Performance Metrics: Discusses critical metrics such as packet loss, throughput, and bandwidth that affect and reflect the performance of network systems.
For a more detailed examination, you can view the complete note here.
Appendix
Factors Affecting Bandwidth
Bandwidth: The capacity of the link, measured in bits per second (bps), determines how quickly the bits can be sent. Higher bandwidth links can transmit data faster, reducing transmission delay.
The capacity of a link is often referred to as bandwidth. Bandwidth is the maximum rate at which data can be transferred over a network link or connection in a given amount of time, typically measured in bits per second (bps), kilobits per second (Kbps), megabits per second (Mbps), gigabits per second (Gbps), etc.
To elaborate, bandwidth can be thought of in two primary contexts:
-
Theoretical Bandwidth: This is the maximum possible data transfer rate that a link can support under ideal conditions, as defined by the technology and standards of the medium and equipment used. For example, a standard Ethernet cable might support up to 1 Gbps.
-
Effective Bandwidth: This is the actual data transfer rate that can be achieved, which might be lower than the theoretical maximum due to various factors such as network congestion, protocol overhead, interference, and the quality of the physical connection.
There are several factors that affect the value of bandwidth:
-
Transmission Medium: The type and quality of the physical medium (e.g., fiber optics, copper wire, wireless) directly impact the bandwidth. Fiber optics, for instance, can support much higher bandwidths compared to traditional copper cables.
-
Network Technology and Standards: Different networking standards specify different bandwidth capabilities. For example, Wi-Fi 6 offers higher bandwidth compared to Wi-Fi 5.
-
Signal Modulation and Encoding Techniques: Advanced modulation techniques can increase the amount of data transmitted per unit of time over a given medium.
-
Hardware Quality and Configuration: The specifications and configurations of network hardware like routers, switches, and network interface cards (NICs) can influence the available bandwidth.
-
Environmental Factors: In wireless networks, physical obstructions, distance, and electromagnetic interference can reduce effective bandwidth.
-
Network Traffic and Congestion: The amount of traffic and the number of users sharing the same network resources can impact the effective bandwidth available to each user.
-
Protocol Overheads: The efficiency of network protocols can also impact the bandwidth. Protocol overheads (such as headers, error checking, and retransmissions) can reduce the effective data rate.
In summary, bandwidth represents the data-carrying capacity of a network link. It is a critical factor in determining how quickly data can be transmitted from one point to another over the network. Understanding and optimizing bandwidth is essential for improving network performance and efficiency.
 50.005 CSE