Wireshark is a powerful tool used to capture packets sent over a network and analyse the content of the packets retrieved. The file dnsrealtrace.pcapng contains a trace of the packets sent and received when a web page is downloaded from a web server over the SUTD network.
In the process of downloading the web page, DNS is used to find the IP address of the server.
Observe Wireshark Capture File
Open the dnsrealtrace.pcapng in Wireshark and answer the following questions. You can refer to Wireshark tutorial here before proceeding, but most things are self-explanatory. If the download link doesn’t work, head to eDimension Week 13 to get the file.
After opening the file, you should have this interface:
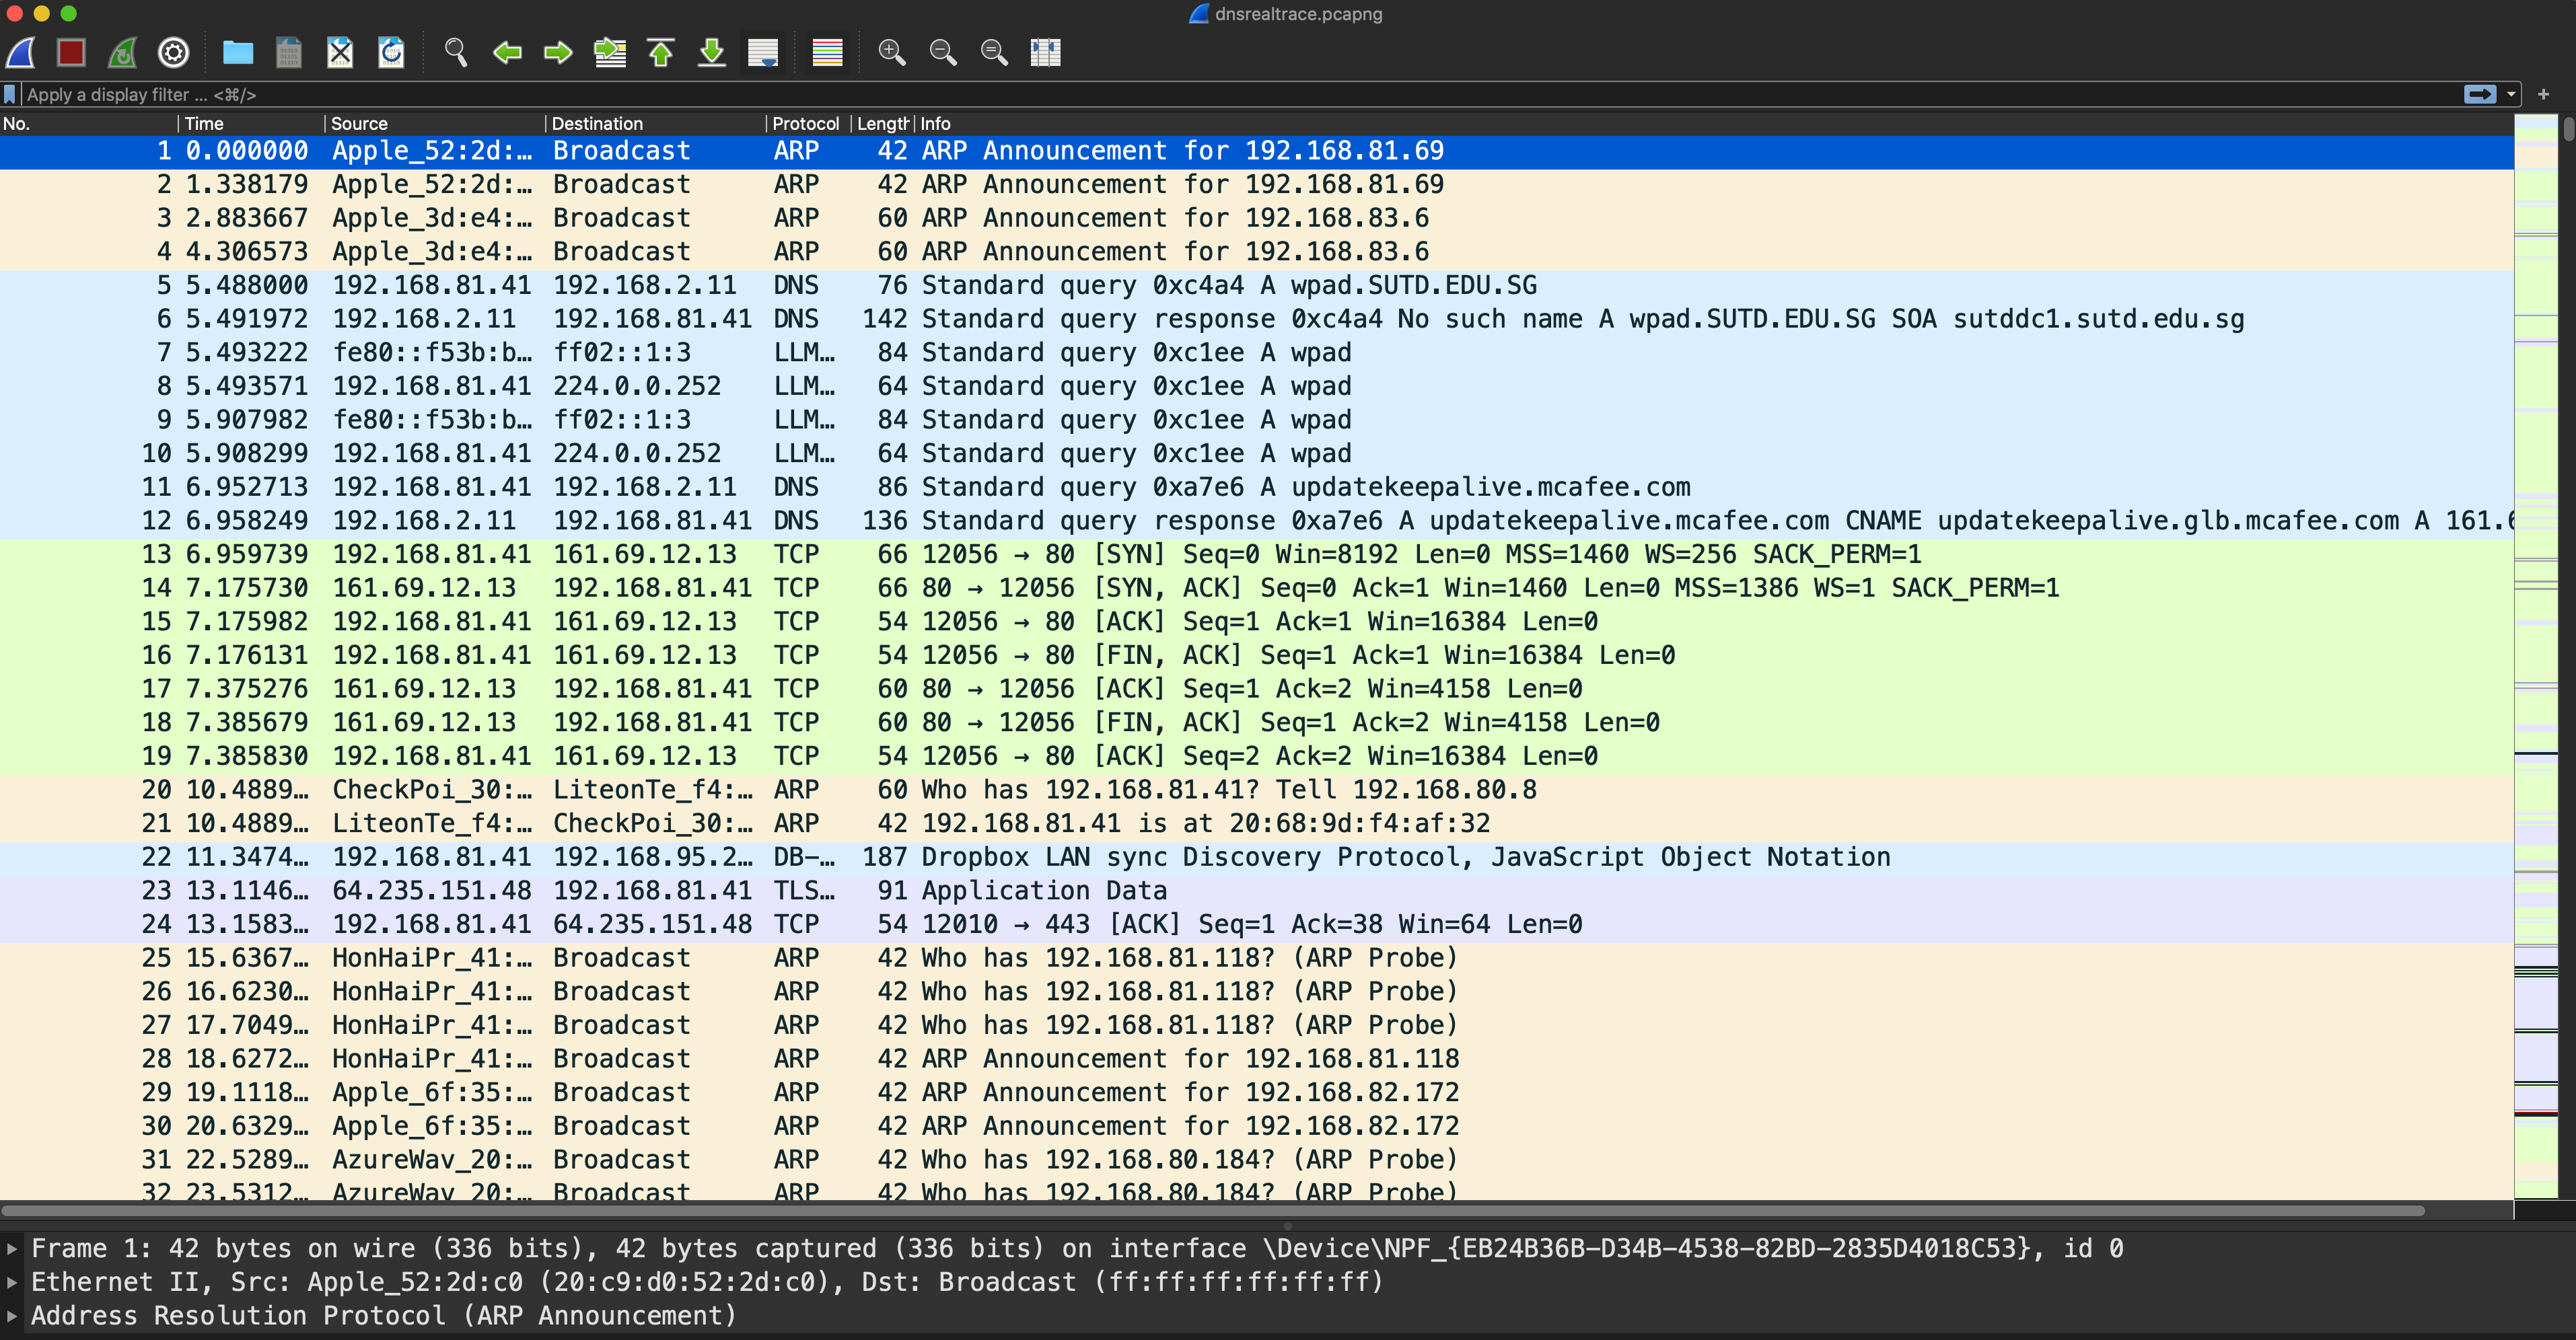
Task 12
TASK 12: Locate the DNS query and response messages. Are they sent over UDP or TCP?
Which numbers are these DNS query packets? Hint: look under protocol DNS
Task 13
TASK 13: What is the destination port for the DNS query message? What is the source port of the DNS response message?
Task 14
TASK 14: What is the IP address to which the DNS query message was sent? Run scutil --dns to determine the IPv4 address of your local DNS server. Are these two addresses the same?
Task 15
TASK 15: Examine the second DNS query message in the Wireshark capture. What type of DNS query is it?
- Does the query message contain any answers?
Then examine the second DNS response message.
- How many answers are provided?
- What does each of these answers contain?
Task 16
TASK 16: Locate a TCP SYN packet sent by your host subsequent to the above (second) DNS response.
This packet opens a TCP connection between your host and the web server. Does the destination IP address of the SYN packet correspond to any of the IP addresses provided in the DNS response message?
Optional Activity
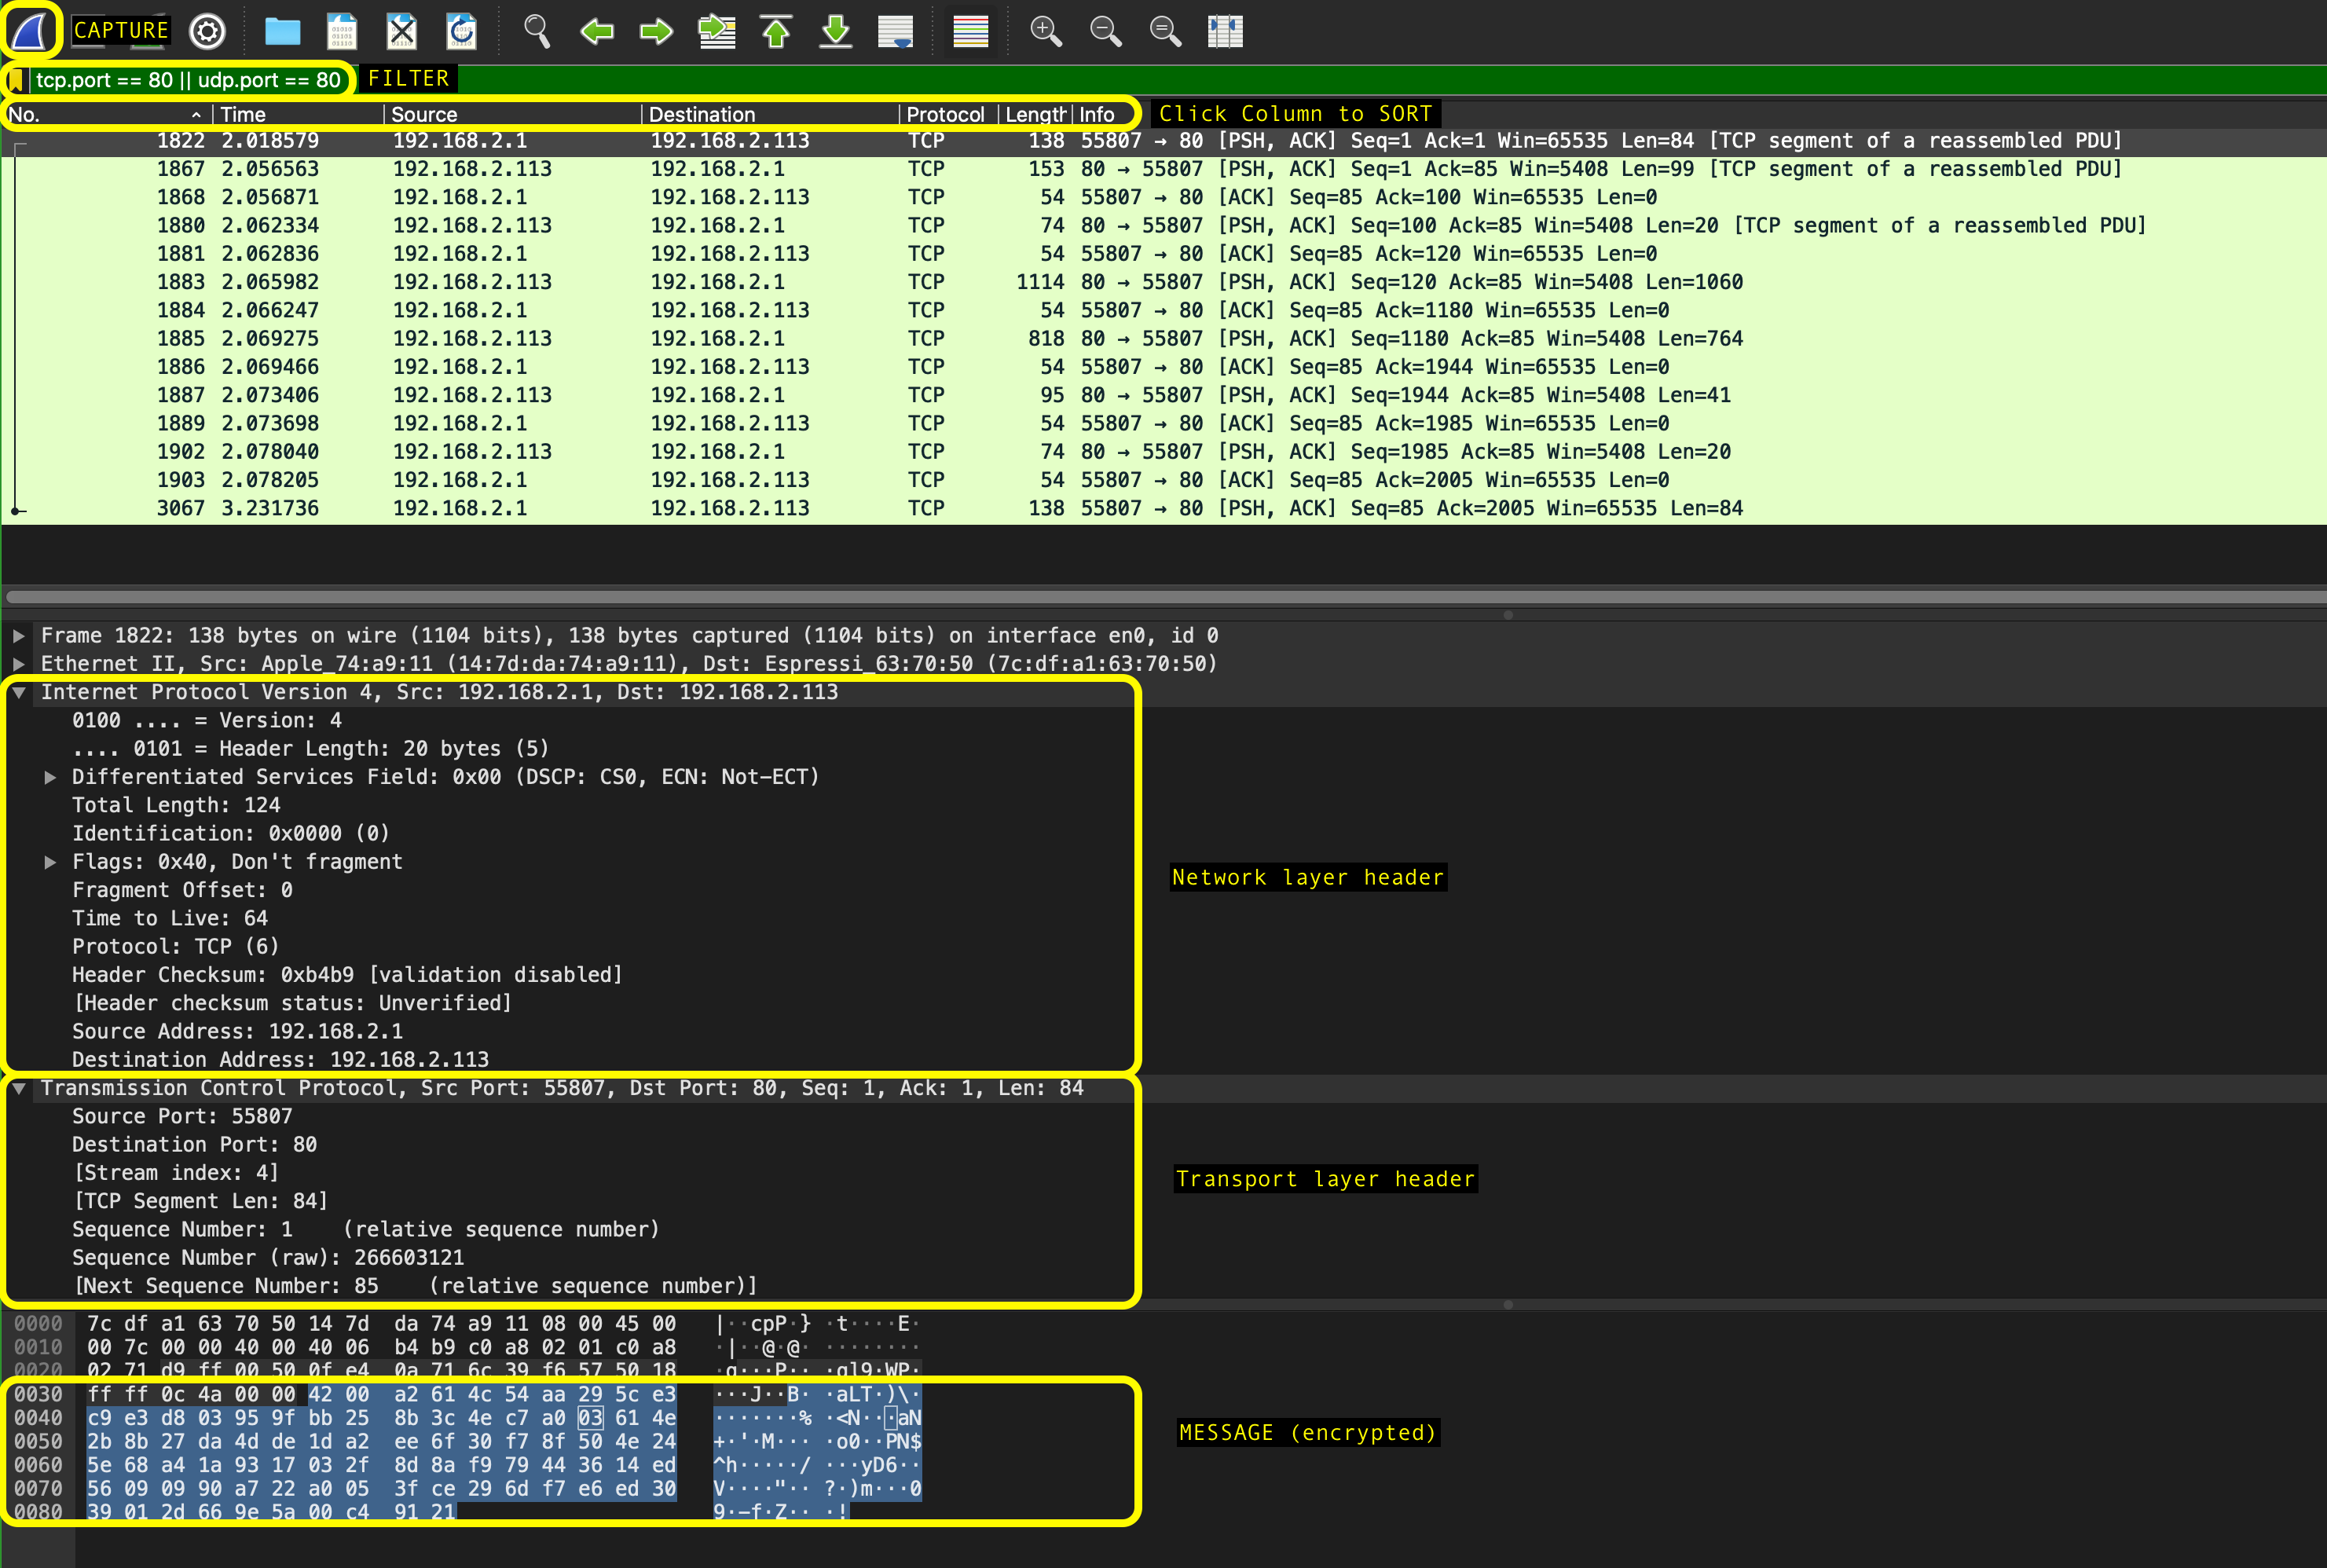
Capturing packets for packet analysis with wireshark:
-
Once the program is launched, select the network interface to capture and click on the sharkfin icon at the top left of the application right under the menu bar to begin capturing packets. If you click on each packet, you can see each layer’s header and the application layer payload.
-
To explore the interface, mention the interface (e.g.
eth0,wlan) in the capture option. -
There are display filters to analyse the packets.
- Protocols: TCP, UDP, ARP, SMTP, etc.
- Protocol fields: port, src.addr, length, etc. (E.g.
ip.src == 192.168.1.1) - For more detailed instructions on Wireshark, refer to its official homepage